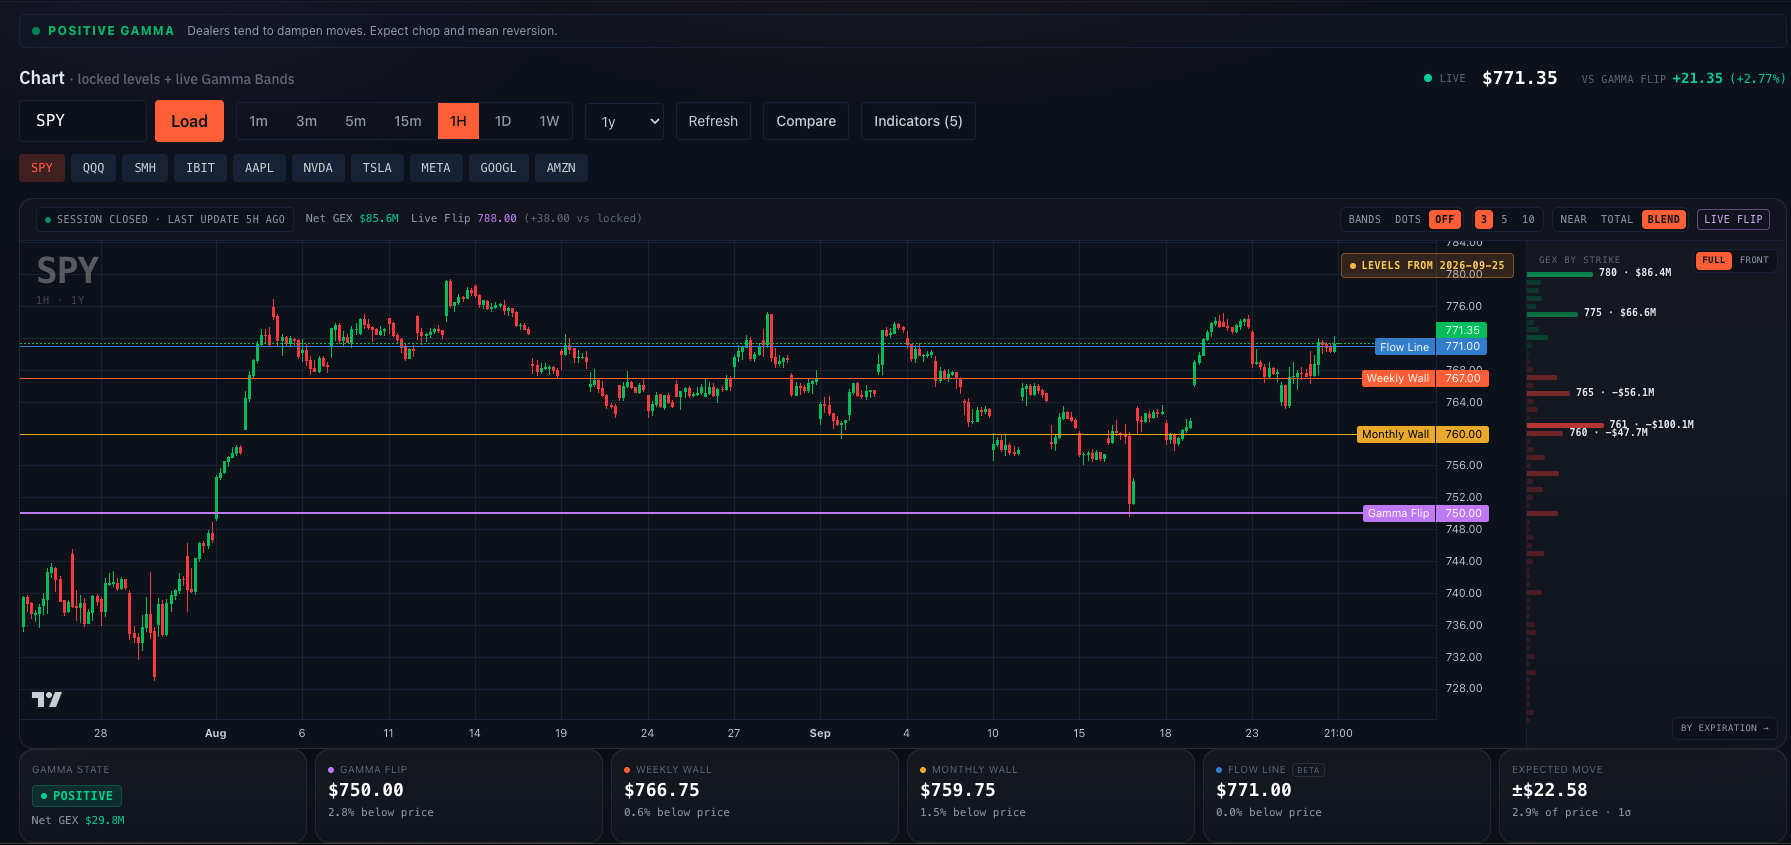
SPY & QQQ, locked before the open.
These are today’s real levels, not a demo. The gamma state is public; the prices unlock with your email — and then land in your inbox before every open.
One email per trading day. Unsubscribe with one reply.
Dealers tend to dampen moves. Expect chop and mean reversion.
Levels hidden — free with your email above
Levels hidden — free with your email above
Four proprietary levels, printed on every chart before the open.
Every night the engine reads the full options chain on 400+ names and computes where dealer hedging is forced to concentrate. That becomes four lines per ticker — computed after the close, locked before the open, never redrawn. The plan you read at 9:00 is the plan all day.
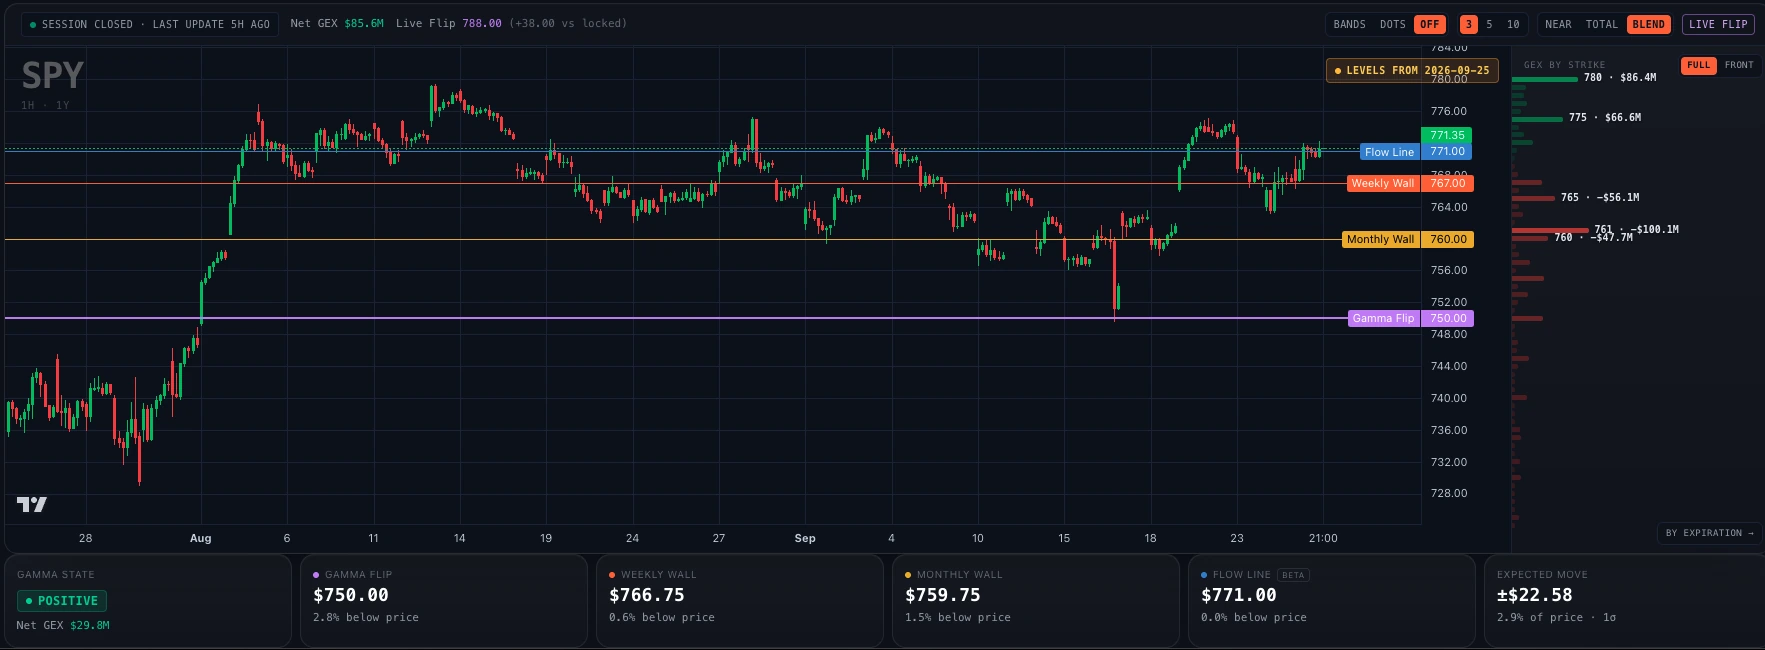
Above it, dealer hedging tends to dampen moves: days chop and mean-revert. Below it, the same hedging amplifies them: days trend and swing wider, in both directions. Not bullish or bearish; calm water or rough.
The strike where this week’s dealer hedging is thickest. Price tends to react here rather than drift through: the first reference underneath when price is above it, the first overhead when below.
The same idea across the monthly expiration cycle. It moves slowly night to night, and price has tended to drift toward it or stall at it over days rather than hours.
Not where hedging sits, but where fresh options positioning went in over recent sessions. Fresh positions have live defenders, so it tends to matter on a swing timeframe.
Levels tend to matter; some days they don’t. Nothing here is a signal or a prediction. How each one is read →
Know what kind of day you woke up in — and watch it change.
Every night we read the full options chain and compute dealer gamma at every strike. Where that money concentrates becomes four locked lines. Then, from the open, live Gamma Bands show that gamma moving strike by strike, minute by minute.
- The gamma statePositive gamma tends to mean chop and mean-reversion; negative gamma tends to mean trend and wider swings. One line decides which.
- Gamma Bands, liveGold for call gamma, teal for put gamma, drawn on the candles and redrawn every minute — the locked lines say where dealers start the day, the bands show where they are now.
- The GEX heatmap behind themThe whole option chain as one grid — every strike, every expiration — so you can see which date a wall belongs to and when it rolls off.
| Strike | Wed 9/23 | Thu 9/24 | Fri 9/25 | Mon 9/28 | Wed 9/30 | Fri 10/2 | Fri 10/9 |
|---|---|---|---|---|---|---|---|
| 609 | 822K | 3.2M | 4.2M | 4.4M | 4.1M | 743K | 2.8M |
| 608 | 3.3M | 1.6M | 16.0M | 5.4M | 6.4M | 3.7M | 2.4M |
| 607 | 338K | 3.2M | 9.3M | 5.6M | 9.3M | 7.5M | 913K |
| 606 | 18.3M | 681K | 50.8M | 11.2M | 23.2M | 10.0M | 902K |
| 605 | 3.6M | 3.8M | 797K | 2.3M | 5.6M | 2.6M | 320K |
| 604 | 1.7M | 4.9M | 19.2M | 11.0M | 6.6M | 6.5M | 8.1M |
| 603 | 420K | −832K | 231M | 8.2M | 9.0M | 4.7M | 2.6M |
| 602 | 936K | 1.1M | 12.7M | 2.7M | 4.5M | 258K | 650K |
| 601 | 416K | −478K | −121K | 1.9M | −2.8M | 4.0M | 321K |
| 600◀ | 86K | −1.4M | 229K | −667K | −347K | 305K | |
| 599 | −403K | −1.6M | −8.2M | −527K | −1.4M | −214K | |
| 598 | −5.7M | −5.8M | −431K | −4.8M | −5.7M | −6.3M | −1.0M |
| 597 | −5.5M | −7.4M | −85.8M | −4.7M | −13.0M | −6.5M | −3.3M |
| 596 | −15.3M | −5.9M | −10.8M | −12.4M | −991K | −4.2M | −8.1M |
| 595 | −16.3M | −18.3M | −25.9M | −21.9M | −13.3M | −1.8M | −5.5M |
| 594 | −1.2M | −6.1M | −13.2M | −4.1M | −3.0M | −9.8M | −6.1M |
| 593 | −13.0M | −2.3M | −8.8M | −4.9M | −7.9M | −6.2M | −529K |
| 592 | −8.9M | −5.1M | −12.7M | −5.9M | −6.8M | −381K | −3.0M |
| 591 | −7.8M | −3.3M | −3.1M | −5.1M | −4.1M | −5.3M | −2.6M |
| 590 | −4.3M | −3.3M | −8.9M | −4.7M | −6.0M | −464K | −398K |
| 589 | −2.3M | −2.8M | −4.4M | −4.3M | −3.5M | −4.4M | −1.8M |
Where the new money went — with the exact contract.
Live flow feeds bury you in prints: hedges, spreads, noise. We scan 400+ names after the close for positioning that actually opened, and name the one contract carrying the most of it.
- Confirmed by open interestA position counts when the next day’s open interest shows it was opened and still held — not because one print looked big.
- Lean and tilt, in one glanceBullish or bearish, and how lopsided: new money leaning 5.9 : 1 toward upside strikes reads very differently from 1.2 : 1.
- A research list, not a tip sheetStrike, expiry and premium so you can follow along — and check it against the levels before you do anything.
New positioning leans 5.9:1 toward upside strikes, concentrated in the swing tenor. 28 contracts on that side were confirmed opened and still held at the close.
New positioning leans 3.1:1 toward upside strikes, concentrated in the swing tenor.
New positioning leans 10.0:1 toward downside strikes, concentrated in the swing tenor.
Every level, explained like a person would.
The engine does the math. The AI reads the locked levels, the spot price and the regime — and tells you what they mean in a few sentences. A sanity check before you size in, not a signal.
- Ask about any ticker or level“Where is NVDA versus its Gamma Flip?” “Why does the Weekly Wall matter today?”
- Grounded in the numbersAnswers cite the actual locked prices — no vibes, no recycled headlines.
- Never tells you what to buyIt explains positioning. The decision stays yours.
From the options chain to four lines on your chart.
After the close, we read the full options chain on SPY, QQQ and 400+ names — every strike, every expiration, where real money is actually positioned.
That positioning forces dealers to hedge. We calculate dealer gamma (GEX) at every strike: the dollars of forced buying and selling parked at each price.
Where the money concentrates becomes the Gamma Flip, the Walls and the Flow Line — locked before the open so the plan can’t move after the fact. From the bell, Gamma Bands track the live gamma on top.
The whole morning read, in one email.
The gamma state up top. SPY and QQQ levels underneath. Three or four unusual options flows with the exact contracts. One chart with the Gamma Map. No essay, no fifteen links, no “markets were mixed.”
It lands before the open and takes about a minute. The levels are locked the night before and don’t move during the session.
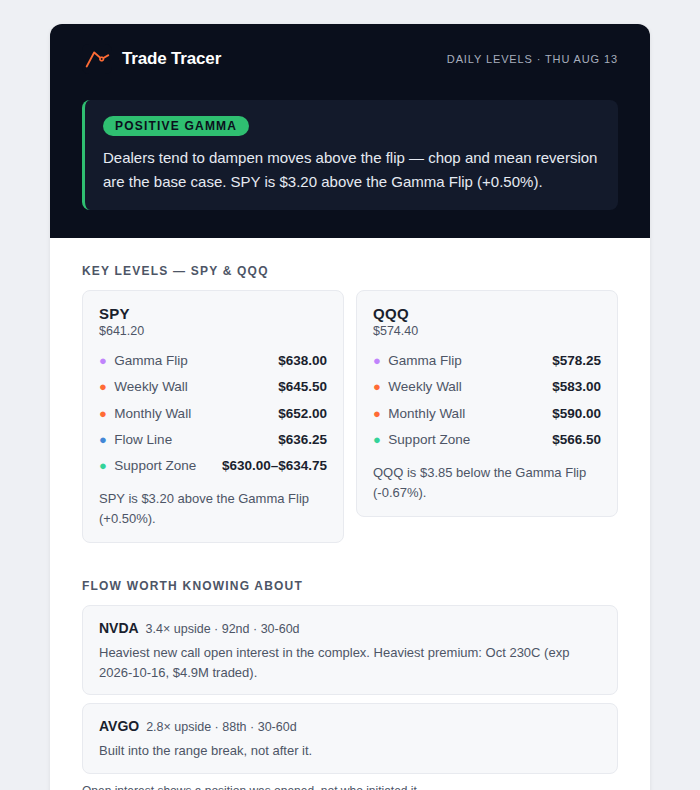
The daily template, rendered exactly as it sends.
Start free. Go Pro for live.
The morning read, free.
- SPY & QQQ levels, locked before the open
- The market’s gamma state, every morning
- 3–4 unusual options flows, with the exact contracts
- The Gamma Map chart for SPY
- Plain-English notes on what each line means
$699 billed yearly, renews automatically · save $249 vs monthly
Start Pro- Gamma Bands — live dealer gamma by strike, gold for calls, teal for puts, redrawn every minute on the chart
- Live GEX ladder and heatmap on SPY, QQQ, IWM, DIA, SMH, DRAM and the Mag 7
- Multi — charts, ladders and heatmaps for several names on one screen
- Locked levels on 400+ stocks & ETFs — Gamma Flip, Weekly & Monthly Walls, Flow Line
- Nightly unusual options flow across 400+ names, with the contract carrying the money
- Ask AI — plain-English reads on any ticker or level
Secure checkout by Stripe. Cancel any time from your account page — access runs to the end of the period you paid for.
Start with the free daily email — SPY & QQQ levels, the gamma state and 3–4 unusual flows, before every open. Upgrade whenever you want every name.